U.S. Greenhouse Gas Emissions: A Closer Look
By Bree Murphy

Global greenhouse gas (GHG) emissions have been steadily rising, reaching approximately 37 gigatons in 2021 (1). Among all nations, the United States ranks second in total GHG emissions—behind China and ahead of India. Together, these three countries contribute over 40% of global emissions, while the bottom 100 countries combined account for less than 3 percent, WRI data show.
U.S. Emissions at a Glance
When measuring emissions per person, the U.S. far outpaces most other nations. In 2019, Americans emitted an average of 17.56 tons of CO₂ equivalent per capita, compared with 12.91 tons in South Korea, according to WRI.
In 2022, total U.S. emissions topped six billion metric tons of CO₂ equivalent, reports the Environmental Protection Agency (EPA). The majority comes from burning fossil fuels for transportation, as more than 94 percent of all fuel used in that sector is still gasoline or diesel, the agency notes.
U.S. Emissions by Sector
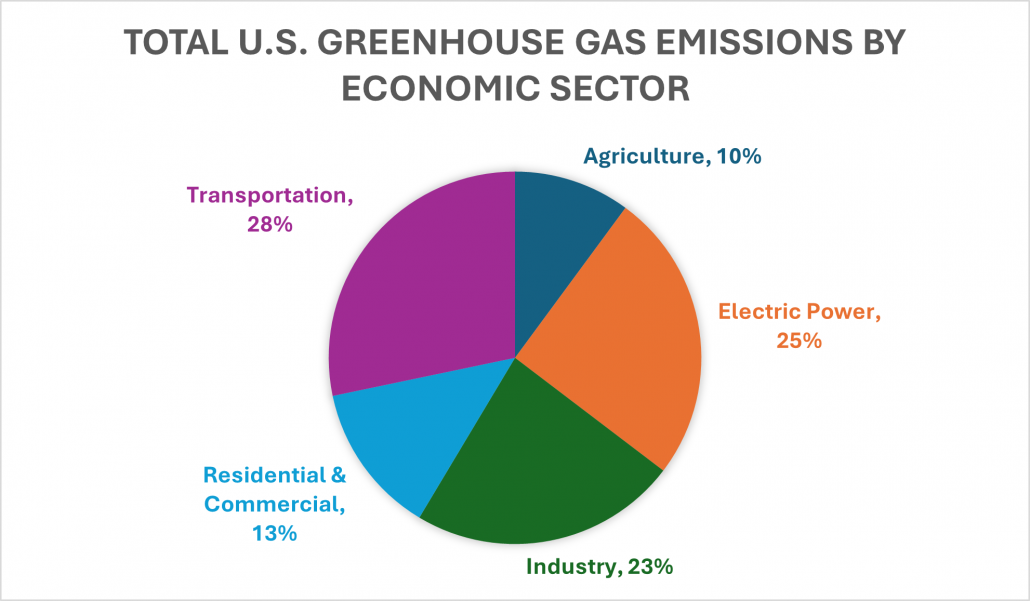
The EPA divides U.S. emissions into five main sectors: agriculture, electric power, industry, residential and commercial, and transportation. Agriculture includes emissions from livestock and soil management; the electric power sector covers the generation and transmission of electricity; industry encompasses the manufacturing of goods and raw materials; residential and commercial emissions come from heating, cooling, and lighting buildings; and transportation includes all emissions from moving people and goods.
According to the EPA’s 2024 Inventory of U.S. Greenhouse Gas Emissions and Sinks by State report, transportation and electric power remain the two largest contributors.
Kansas and Missouri: A Regional Snapshot
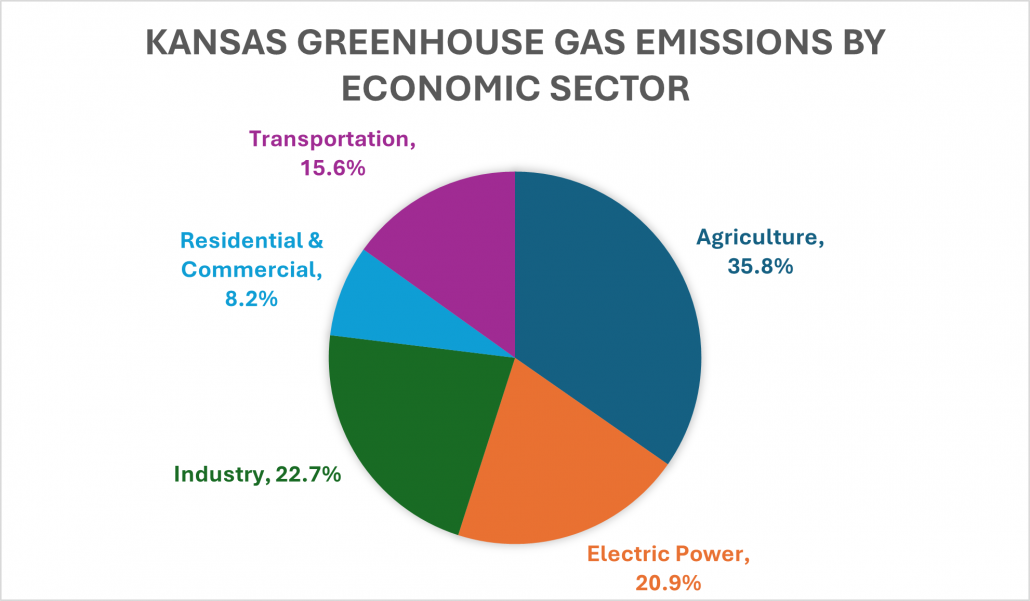
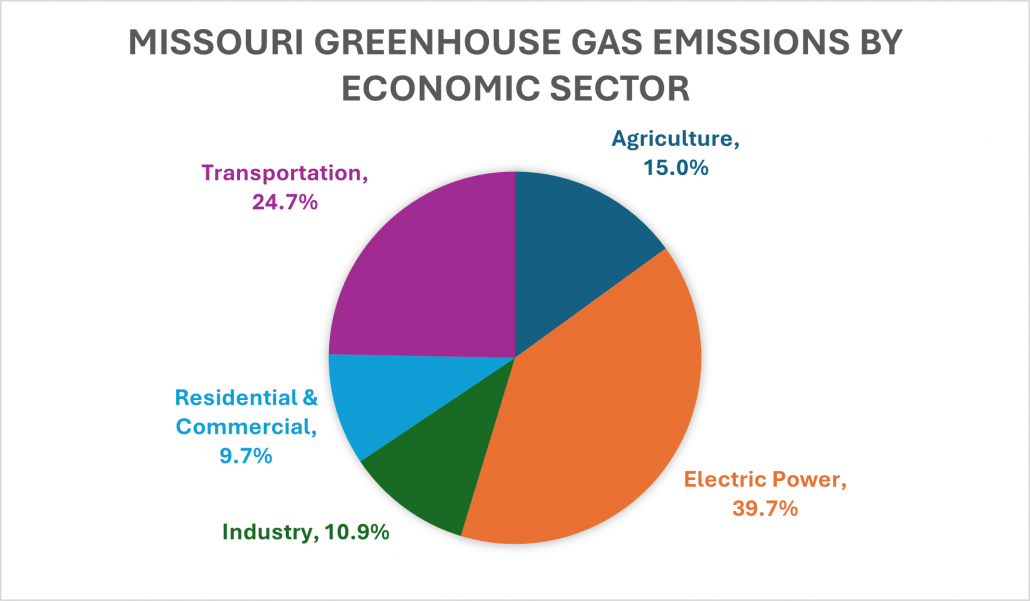
The EPA estimates that Kansas produced about 109 million metric tons of CO₂ equivalent in 2021, while Missouri emitted roughly 154.5 million metric tons. Kansas ranked 24th nationally in total emissions, while Missouri ranked 11th. When looking specifically at transportation, Kansas ranked 34th, and Missouri 18th.
Both states combined account for just over 4 percent of national emissions, according to EPA data. Despite Missouri’s smaller geographic area—it’s the eighteenth largest state by size, compared to Kansas at thirteenth—its emissions are considerably higher, reflecting differences in industrial activity and population density, based on information from State Symbols USA and Britannica.
Totals may not equal 100% due to rounding. Information found on the EPA website.
Breakdown of Kansas and Missouri’s Emissions
| Kansas | Missouri | |
| Total Emissions (MMT CO2E) | 109 | 154.5 |
| Transportation Emissions (MMT CO2E) | 17 | 38.1 |
| Percent of All U.S. Emissions | 1.73% | 2.45% |
| Percent of U.S. Transportation Emissions | 0.94% | 2.11% |
| Rank in Total Emissions | 24th | 11th |
| Rank in Transportation Emissions | 34th | 18th |
| Rank in Area (sq miles) | 13th | 18th |
| Rank in Population | 34th | 18th |
MMT CO2E = million metric tons of carbon dioxide equivalent. The ranks are out of the 50 U.S. states, with 1st being the highest number. Calculations made based on information found on the EPA website.
Totals may not equal 100% due to rounding. Information found on the EPA website.
Totals may not equal 100% due to rounding. Information found on the EPA website.
Transportation Emissions
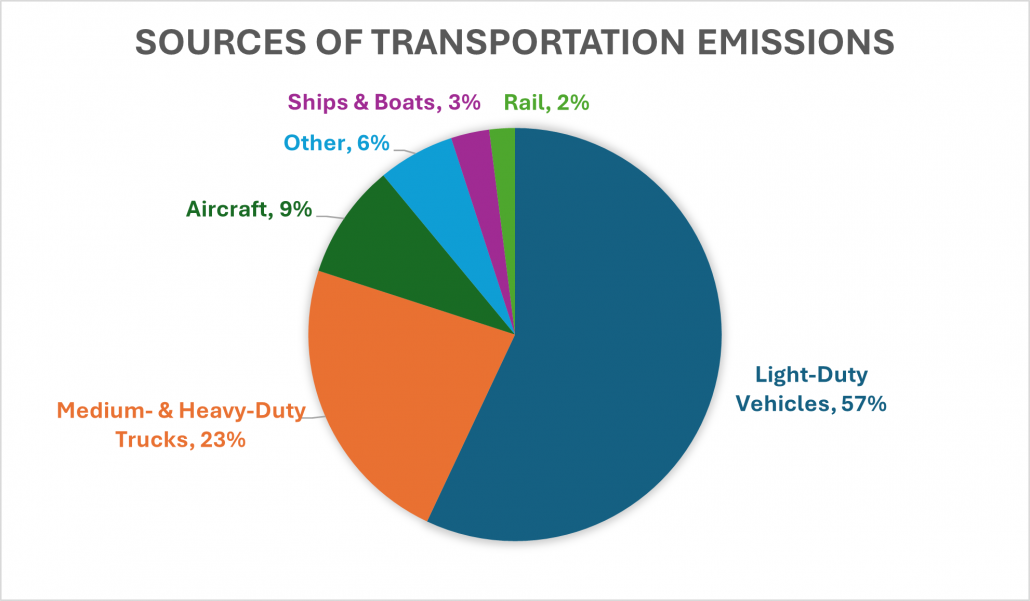
Transportation remains one of the largest—and fastest-growing—sources of greenhouse gases globally. The Intergovernmental Panel on Climate Change (IPCC) reports that North America produced more than two gigatons of CO₂ equivalent from transportation in 2019, more than any other region. East Asia followed with about 1.25 gigatons.
EPA data show that between 1990 and 2022, miles traveled by U.S. light-duty vehicles rose by nearly fifty percent, driven by population growth and economic expansion. By 2022, Americans collectively drove 2.85 trillion miles.
Each gallon of gasoline burned releases about 8,887 grams of CO₂, while diesel emits roughly 10,180 grams, according to the EPA. Over a year, the average passenger vehicle produces about 4.6 metric tons of CO₂.
How much CO2 is emitted?
| From one gallon of gasoline | 8,887 grams CO2 |
| From one gallon of diesel | 10,180 grams CO2 |
| From driving one mile* | 400 grams CO2 |
| Annually* | 4.6 metric tons CO2 |
*Calculations made based on average passenger vehicle. All calculations are approximate. Information found on the EPA website.
Information found on EPA website. Emissions from equipment related to agricultural, construction, mining, lawn & garden, logging, and recreational activities are not included.
Types of Vehicles
| Light-Duty Vehicles | cars, pickup trucks, SUVs, minivans |
| Medium- & Heavy-Duty Trucks | trucks used for service, utility, cargo transportation |
| Aircraft | commercial and military aviation |
| Other | buses, motorcycles, pipelines |
Emissions from pipelines include the combustion of natural gas used to power the pumps. Information found on EPA website.
Understanding Greenhouse Gases
Carbon dioxide isn’t the only culprit. Methane (CH₄) and nitrous oxide (N₂O) also play major roles in trapping heat. The EPA explains that methane, often released from fossil fuel production and livestock, absorbs about 28 times more energy per ton than CO₂ but remains in the atmosphere for a shorter period. Nitrous oxide, primarily from agriculture and fuel combustion, is even more potent—298 times stronger than CO₂ over a 100-year period, according to Climate Change Connection.
How You Can Reduce Your Emissions
Small changes can add up to a big impact—and often save money over time. The EPA suggests that small, everyday changes can make a meaningful difference.
- Switch to alternative fuels (biodiesel, electric, or CNG)
- Avoid rapid acceleration and braking
- Drive the speed limit and reduce idling
- Combine errands (“trip chaining”)
- Keep up with vehicle maintenance
- Choose a smaller or more efficient vehicle
- Support local businesses
- Work from home or use public transit, carpool, walk, or bike
- For long trips, consider train travel instead of driving or flying (5,15)
The U.S. Department of Energy’s Alternative Fuels Data Center offers detailed information on sustainable fuel options. Its Station Locator, maps alternative fueling stations across the U.S., Puerto Rico, and Canada—covering biodiesel, electric chargers, ethanol, hydrogen, LNG, propane and renewable diesel.

