written by Emily Wolfe, MEC’s Senior Public Affairs Coordinator

As we near the end of the year, it is anticipated that Congress will be discussing whether to extend certain federal tax credits such as the Alternative Fuel and Energy Efficiency Tax CreditsContact your representative to learn if they will support extending the Alternative Fuel Tax Credit and below energy efficiency tax incentives that also expire at the end of 2020. (Note that biodiesel credits are covered under the Biodiesel Income Tax Credit which continues through December 31, 2022. The Renewable Energy Tax Credits expire December 31, 2021.) 

  • Alternative Fuel Tax CreditA tax incentive is available for alternative fuel that is sold for use or used as a fuel to operate a motor vehicle. A tax credit of $0.50 per gallon is available for the following alternative fuels: natural gas, liquefied hydrogen, propane, P-Series fuel, liquid fuel derived from coal through the Fischer-Tropsch process, and compressed or liquefied gas derived from biomass. 
  • Commercial Building Energy-Efficiency Tax DeductionA tax deduction of up to $1.80 per square foot is available to owners of commercial buildings or systems that save at least 50% of the heating and cooling energy as compared to ASHRAE Standard 90.1-2007 (or 90.1-2001 for buildings or systems placed in service before January 1, 2018). The deduction is available for buildings or systems placed in service after December 31, 2017 through December 31, 2020. Partial deductions can also be taken for measures affecting the building envelope, lighting, or heating and cooling systems.
  • Residential Tax Credits for Energy Equipment & Energy Efficiency Improvements: Homeowners can claim a federal tax credit for installing appliances that are designed to boost energy efficiency or making certain improvements to their homes (10% of cost up to $500 or a specific amount from $50-$300).  
  • Tax Credits for Builders of Energy Efficient HomesHome builders are eligible for tax credits for a new energy efficient home that achieves energy savings for heating and cooling over the 2006 International Energy Conservation Code (IECC) and supplements. A required amount of energy savings must come from building envelope improvements. This credit also applies to contractors of manufactured homes conforming to Federal Manufactured Home Construction and Safety Standards and meeting the energy efficiency requirements. Alternatively, a manufactured home also qualifies for a $1,000 tax credit if it meets ENERGY STAR requirements. 

If you would like additional information regarding the above incentives visit the Database of State Incentives for Renewable Energy (DSIRE)email your Clean Cities coordinator, or contact MEC at (816) 531-7283. 

We are funded by readers like you. Even $5 helps expand clean energy access.
Your donation helps scale new technologies—tools that are public-ready, but only utilized by people of moderate affluence at a minimum. Clean-energy technology is a game changer, not only for the planet, but also for small businesses and low-income households. Thank you for helping to broaden clean tech's horizons.

written by Kansas City Regional Clean Cities Coalition director David Albrecht

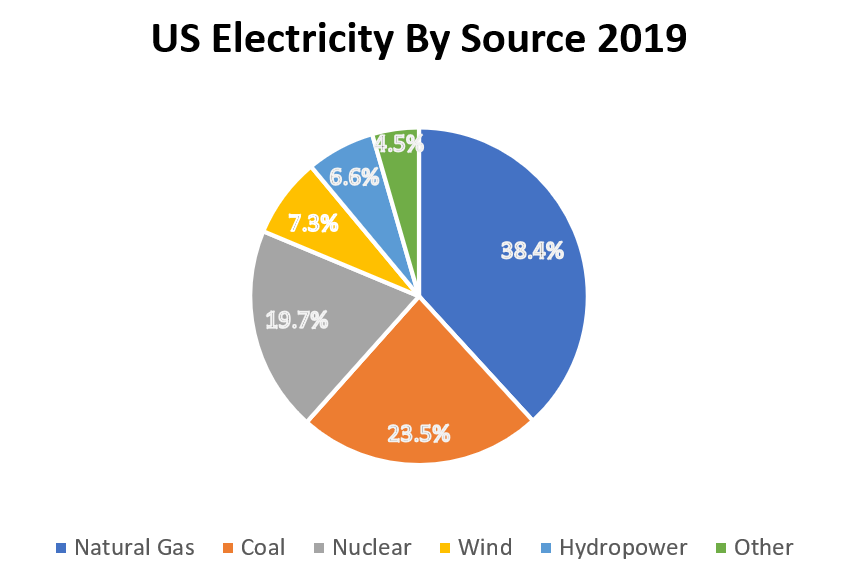
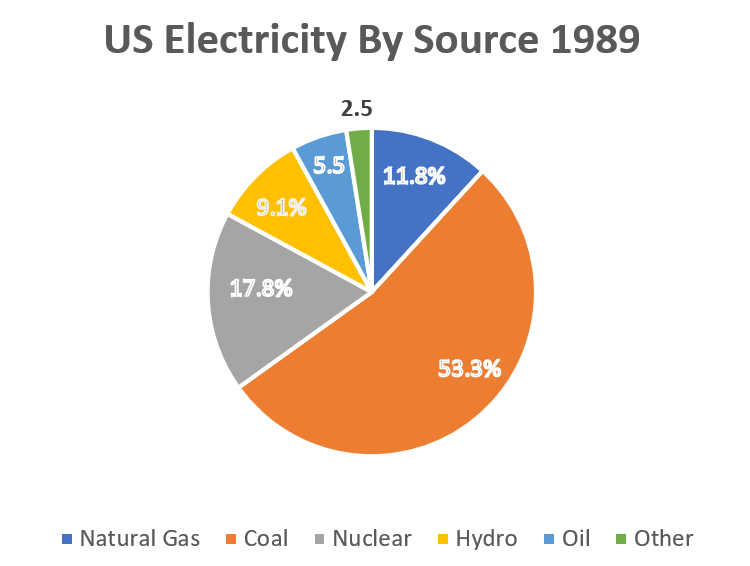
It’s easy enough to find information about energysometimes too much information to get a handle onSo, when thinking about energy in the United States, it’s not a bad idea to simplify thingsthere’ll be time for details later. For electricity, think of The Big Five. The five biggest power sources provided 95.5% of all the electricity generated in the United States in 2019. They were, from biggest to smallest: Natural Gas (38.4%), Coal (23.5%), Nuclear (19.7%), Wind (7.3%) and Hydropower (6.6%). Last year, the Big Five generated nearly all of total US output of 4.12 million Gigawatt hours of power.But just as energy is always moving, our sources of energy are a moving target as well. Go back 30 years, and you’ll see a very different picture. Since 1989, coal’s share of the electricity market has collapsed to less than half of what it was, while natural gas has more than tripled. Nuclear power and hydroelectricity have declined slightly. Oil-fired power plants have largely disappeared. Meanwhile, wind generation, which essentially didn’t exist in 1989, has more than made up for the end of the oil-burnersAnd most of these changes took place within the last decade, not gradually. If you get only one essential takeaway from this very brief overview, it should be thisAmerica’s electrical grid is undergoing huge changes, along with the energy sources that power it, and the pace of those changes is accelerating.

As this series of articles continues, we’ll fly lower across this landscape to pick out more detailsand to ask more questions. As coal declines, what choices will states like West Virginia and Montana confront? What new technologies are in the pipelineand which old technologies can be reworked? Can we maintain our energy-rich lives in a climate that’s increasingly unpredictable? To what degree can we electrify transportation or buildingsAnd should weThe choices we make, and those that are made for us, will define our world for decades to come. 

We are funded by readers like you. Even $5 helps expand clean energy access.
Your donation helps scale new technologies—tools that are public-ready, but only utilized by people of moderate affluence at a minimum. Clean-energy technology is a game changer, not only for the planet, but also for small businesses and low-income households. Thank you for helping to broaden clean tech's horizons.

written by Kansas City Regional Clean Cities Coalition director David Albrecht

You have power.   

Your access to energy would have cracked human credulity for most of our species’ time on earth. For millennia, we elbowed away the margins of night with the smoking glow of wood, grass or buffalo chips. Just 200 years ago, whale oil and candles lit the homes of a slowly industrializing world—for those who could afford them. For those who couldn’t, wood remained the main source of light, heat and cooking, along with the coal that drovthat industrialization. Now, in an eye-blink of human history, we have become the beneficiaries of a world in frenzied motion.   

The energy we use never stops moving. It hurtles from point to point at velocities approaching the speed of light. It slowly plows the oceans in ships big enough to dwarf the fever-dreams of Pharaohs. It is explosive coal dust shot into a furnace, feeding flames five stories high hot enough to melt platinum. It is water roaring 600 feet down a pipe, turning a generator the width of a small house 100 times per minute. It is mazes of pipes and conduits, steam and heat, toxic and explosive chemicals, all combining to refine Jurassic sunlight into jet fuel and gasoline. It is today’s sunlight knocking electrons out of their orbits and into batteries and wires. It is the fission of a single uranium atom unleashing enough energy to make a grain of sand visibly jump, triggered by a neutron moving 1.4 miles per second in reactor spaces unimaginably dense with such reactions. This frenzied motion never stops, only occasionally slows, and makes our world—food, music, lighting, medicine, communications, trade, everythingpossible. 

As Americans, how does all this shake out? What drives our nation’s energy system today, and what will that system look like tomorrow? And what kind of future do we face as the consequences of this vast, and amazingly productive disruption become clearer? These are the kinds of questions this continuing series of short essays will try and provide some answers to.   

We are Metropolitan Energy Center. Part of our mission is to present the best information available on energy, its principles, power and drawbacks, whether it’s heating your house or powering your car. We’ll be covering a lot of ground–from the grid to the feedlot, and from alternative fuels to solar technology. We’ll touch directly on the projects we pursue and probe larger questions of energy policy. We hope that in the process we can hold your interest, provide food for thought, and perhaps puncture a few myths about what new technologies can and can’t do.   

Things are already moving fast, and we hope you’ll hop on board for this excursion.

We are funded by readers like you. Even $5 helps expand clean energy access.
Your donation helps scale new technologies—tools that are public-ready, but only utilized by people of moderate affluence at a minimum. Clean-energy technology is a game changer, not only for the planet, but also for small businesses and low-income households. Thank you for helping to broaden clean tech's horizons.

So, when we talk about someone employed in “clean energy”, what does that cover?  Like “manufacturing”, many things. The Bureau of Labor Statistics (BLS) defines and tracks employment by sector, but it’s not the most user-friendly resource.  So, while BLS notes that there were nearly 6,000 wind turbine service techs employed in May of 2020, it divides them among five different industries, ranging from utility construction to consulting to local government.  Sadly, a BLS plan to categorize and track clean energy jobs begun in 2010 was abandoned in 2013 during a federal budget shutdown, and has never resumed.

More generally, clean energy jobs fall into four broad categories – energy efficiency (home upgrades or commercial building retrofits); renewables (solar, wind, biogas, or geothermal energy); grid and storage (electrical engineering, battery tech, and charging stations); and cleaner vehicles and fuels (hybrid and electric vehicle manufacturing or biofuel production).  Altogether, more than 3.3 million Americans work in one of these fields, and it’s worth noting that energy efficiency alone employed more than twice as many people as all fossil energy sectors combined.

Like nearly everybody else, clean energy workers have taken a hit in this economy.  About 147,000 jobs were eliminated in March, and April totals nearly tripled that.  More than 590,000 jobs in the sector evaporated by April 30th, two months ahead of projections by BW Research.  The same analysts now expect around ¼ of all green energy jobs to be gone by June 30th, some 850,000 in all.

Under the circumstances, this isn’t surprising.  Homeowners are unlikely to invite insulation crews into their homes in the midst of a pandemic.  Financial chaos means that banks are less likely to lend on large-scale clean energy deployments.  Cities facing budgets collapsing under tax shortfalls are going to emphasize essential services before clean energy buildouts.  And utilities are facing tumbling energy demand.  IEA estimates that from February through April, global demand for energy dropped 6%, the equivalent of all of India.  American energy demand is set to drop 9%, according to the same report.

Whatever the course of economic contraction and recovery, there are certain irreducible advantages to jobs in these industries.  To begin with, they tend to be site-specific.  Many renewable energy jobs are unlikely to be outsourced – those building and maintaining a thermal solar plant in Arizona, for example, are going to build and maintain it in that location for its useful life.  The same holds true for energy efficiency professionals – the homes and buildings in the United States aren’t going to offshore themselves.

Many skilled green energy jobs pay relatively well, can boost stressed economies and don’t require four-year degrees.  Wind turbine techs, for example, exemplify this beneficial clustering.  Wind turbines require regular service and maintenance, and wind farms are located largely in rural areas in the Midwest and southern Plains.  Technicians tend to live in smaller cities or towns near these sites, supporting the local tax base.  Median income for a turbine technician in 2019 was $52,910, which could go a long way in Russell County, Kansas or Alliance, Nebraska.  And training for the field takes one or two years, depending on program and specialization. Median income for solar installers was lower, but in 2019 stood at $44,890 per year, and for insulation crews, median income in 2019 was $44,180,

The issue, at least for now, is that the three specific categories mentioned above don’t employ very many Americans – about 75,000 in all in 2018 and 2019, according to BLS.  But broaden the focus, and green energy’s economic becomes clearer – and bigger.  Wind energy’s total economic footprint alone is already substantial.  In 2018, 530 plants in 43 states produced components – blades, nacelles, turbines, gearing and digital control systems. Outsourcing of some of this manufacturing is possible, but given the size and weight of components as turbines grow taller, is likely to remain largely here at home.  Moreover, the Department of Energy estimates as many as 600,000 jobs in all subsectors of wind energy in less than 30 years.

This kind of job generation potential is what makes remaking America’s energy system so important to inclusive economic recovery.  Utilities, states and cities are already beginning to implement plans to change how we generate and distribute energy in a carbon-constrained world.  These efforts have been patchy and slow, and to date unlikely to meet even minimal Paris Agreement standards.  But under the right circumstances, policy changes, like technological changes, can happen quickly.  Emphasizing the very real benefits of more clean energy jobs may help speed that vital process.

So where, as COVID redefines economies and politics, is the renewable energy sector?  What happens over the next few years – to technologies, investments, deployments and incentives – will determine multiple trajectories.  These include the jobs of millions of people, how quickly carbon accumulates in the atmosphere and oceans, and the possibility of stranded assets hampering any rapid, substantive switch from old to new.

If you’re thinking purely in terms of dollars and cents, the latest issue of Forbes has a fascinating article.  A joint study by the International Energy Agency (IEA) and Imperial College London reviewed returns on energy investments starting in 2009.  Combining German and French stock market data, the past five years showed returns of 178% for renewables and -20.7% for fossil energy.  UK renewable stocks returned over 75%, legacy energy 8.8%.  Here at home, where utility-scale renewable buildouts began later than in Europe, renewable returns were north of 200%, while oil, gas and coal stocks didn’t quite double.  Renewable investments proved more stable over the same periods measured.  But the same article notes that the biggest fossil energy shareholders – pension funds – are reluctant to disinvest from dividend-rich stocks.

Beyond that, an ostensible renewable energy transition is up against multiple countervailing factors – for starters $900 billion or more in potential “stranded assets” of global fossil energy companies.  The oil majors have talked a good game for years now, but the numbers don’t bear out their proclaimed commitments to renewables.  Exxon is now in court for, among other things, bragging on its green energy tech while spending less than ½ of 1% of revenues on renewable energy.  In 2019, BP projected spending between 3% and 8% (at best) of capex on renewables, and in February the company dumped an advertising campaign highlighting renewables.  And so on.

American utilities face the same kinds of stranded asset risks, though only 18% of utility employees view sunk costs in infrastructure as a top worry.  But power plants can be ferociously expensive to build.  Evergy’s Iatan 2 project, which went online nearly 10 years ago, came in at nearly $2 billion, with state-of-the-art environmental retrofits of the Iatan 1 plant adding to costs.  It can take large projects like this decades to pay for themselves; securitizing early retirement of fossil fuel plants can blunt risks to utilities, but so far has only been tried in three states.

Even bigger picture – there’s a substantial inertia built into an energy economy created more than 100 years ago – a vast, complex system that works remarkably well to meet the needs of its customers.  To date, renewables are still a small slice of total US electricity output.  In 2018, natural gas generated about 35% of our electricity, coal about 27%, nuclear a bit over 19% and all renewables, including hydroelectric, not quite 17%, with niche sources making up the rest.

To be clear, renewable energy’s recent eclipse of coal in the US has been remarkable.  In fact, the US Energy Information Administration (EIA) announced the very day this was written that in 2019 consumption of energy produced from renewables passed that produced by coal, the first time per EIA that this has happened since before 1885.  But a decarbonized energy economy is still decades away.  The International Renewable Energy Agency (IRENA) estimates that to even approach climate goals, renewables must increase to around 65% of global Total Primary Energy Supply by 2050 – and we’re nowhere close to that yet.  More on all of the above, COVID impacts and the state of play in our next renewable installment.

As we all shift our routines in an effort to stay safe and healthy in light of the COVID-19 pandemic, Metropolitan Energy Center is exploring ways to adjust to the new normal. We want you to know we share the collective confusion and frustration of our friends, neighbors, and colleagues. Please remember we are all in this together. Be patient, be kind. And if you need us, we’ll be here, because we have been for over 35 years.

What We’re Doing

As the situation evolves, we are continually adjusting our response. At this time, our dedicated staff are working from home, in consideration of the CDC recommendations and in compliance with the KC Metro stay-at-home order, effective Tuesday, March 25. We are finding innovative ways to support our communities and continue our technical support for regional alternative fuels and energy efficiency advancements.

Staff can best be reached by email, though phone calls are still welcome and will be routed to the appropriate staff as soon as possible on the day the calls are received.

For scheduled meetings and events:

  • All in-person meetings and events for the next 8 weeks are postponed, moved online, or cancelled.
  • Scheduled conference calls will go on and will now offer a web connection in case you are unable to join through a phone connection.

For projects and project deliverables:

  • Staff are conducting a COVID-19 risk assessment for all ongoing projects. If you are involved in a project and believe restrictions due to the crisis present a risk to you meeting your objectives, please notify your MEC staff contact immediately.

Hidden Costs and Silver Linings

This pandemic is something new for nearly all of us. Some Americans—those 75 and older—will remember the polio epidemic of the 1940s and 1950s. But for most of us, this means making changes in the ways we work, live and travel that we’ve never experienced before.

If there’s any sort of silver lining to this situation, it’s that finding new ways to work and move in the next months may lead to longer-term solutions that can improve health outcomes for everyone. COVID-19 is a respiratory illness, and good respiratory health is critical—now, in dealing with this disease, and for our community’s overall health in the future. MEC has worked for decades to cut toxic emissions with energy efficiency, cleaner fuels, intelligent transportation and building systems, and a cleaner, more efficient freight network. This work continues, with our diverse community and stakeholders in mind, and is more critical today than at any other point in history.

What You Can Do

#StayHomeKC. On March 21, elected officials in Jackson, Johnson and Wyandotte counties and the city of Kansas City, Missouri, announced a 30-day stay-at-home order. Other counties in the region have enacted various restrictions to help slow the spread of COVID-19. State and local guidelines are changing rapidly as more cases are confirmed.

For the latest information, check your local health department or city/county websites.

If you should venture away from home, please remember: exhaust irritates lungs. For the sake of those experiencing respiratory difficulty, turn off your engine if you will be waiting for a friend carpooling with you, for car-side delivery service, etc.

Take advantage of your reduced commute time to get outdoors more. Biking, walking and hiking can be done alone, with your pets, or in small groups adhering to social distancing practices.

Some outdoor volunteering opportunities may continue, in small groups adhering to social distancing practices, especially orgs doing wildland management, gardening and cultivation, tree planting, and the like. Carefully evaluate your host’s safety and health policies and practices before signing up. Due to the stay-at-home order, many of these events may be cancelled as well, so contact your host to confirm before showing up.

If you’re a volunteer and miss in-person group volunteering events, stay engaged through GlobalGiving. GlobalGiving’s virtual skilled volunteering platform, GlobalGivingTime, can match you with interesting opportunities from vetted nonprofits around the world, from the convenience of your desk.

Stay Informed

Metro KC officials are keeping PrepareMetroKC.org updated as new information becomes available.

As you know, this situation is continually shifting. We will monitor developments to adhere to federal, state and local advisories, and support the region’s efforts to protect the health and safety of the public.

By: Meggan Shoberg

The health and safety of students in the classroom is of crucial importance. According to the U.S. Department of Education, currently 55 million people spend their time in K-12 buildings. That is about 20 percent of our current population! Teachers, students, administration, and staff are all spending a majority of their time indoors, between the walls of these vital buildings. The students who reside in these buildings consume more oxygen than their adult counterparts, and are afflicted by poor indoor air quality, inefficient energy systems and health risks at a higher rate.

Many Midwest schools have been recipients of Energy Star Awards, and that is an amazing first step to creating the best environment for learning. There are a couple of key considerations to make when analyzing your school building’s efficient and indoor air quality:

  1. Energy Star and other energy benchmarking  programs are a standard for adults, not children. So, area schools should be looking to not just achieve minimum standards, but exceed them to accommodate their most vulnerable residents.
  2. Look at the building’s efficiency during occupied periods of time. While over a 24-hour period, a school may warrant acceptable results, these facilities are unoccupied a portion of the time and experience high traffic during school hours. Energy efficiency measures should account for the time that the building is actually using energy, not when it’s sitting dormant. 

Over the next few months, we will be diving into the topic of efficiency, maintenance and indoor air quality of schools. We’ll be covering the benefits, low-cost improvement measures, EPA tools, and how Metropolitan Energy Center is a great partner for your school’s efficiency project. Stay tuned in the coming months as we explore this critical compenent to protecting the health of our students, and contact Meggan@metroenergy.org with questions about how your school can improve its efficiency.