COVID, Carbon and Clean Energy
Since January, there’s been a lot of discussion, analysis and 151-proof worry about the COVID virus – understandably. Viral impacts have produced (in less than six months) the biggest economic implosion since the 1930s, public health lockdowns spanning the planet, and a global death toll of (at this writing) 434,388, with nearly 116,000 of those confirmed deaths in the United States.
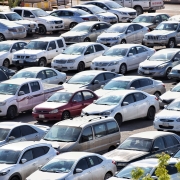
As you’d expect, there has also been a certain amount of silver-lining searching. It’s only natural – as human beings, we look for the lesson, or what we could have done differently or what we might gain in times like these. And with cars off the road and factories closing down, citizens of cities as remote from one another as Los Angeles, Beijing and New Delhi looked out the window and realized something truly strange was happening – the air was cleaner than it had been in years, even decades. This four-minute clip from CBS has visuals that I won’t try to convey via keyboard. For many, the spectacle of suddenly invisible (a.k.a. “normal”) air was startling.
With that kind of obvious impact, the next Big Question didn’t take long to surface: if substantially shutting down Normal looks like this, what kind of impact is it having on the climate? The early returns are in, and the answer is – not much. NOAA reports globally averaged CO2 content of 417.07 ppm (parts per million) for May – up from 414.65 ppm in May 2019 and 411.24 ppm in May 2018. There’s science behind this lack of change. Earth, in effect, breathes – this was Charles Keeling’s great discovery in the late 1950s. Atmospheric CO2 content rises and falls each year, bottoming out in October as most of Earth’s landmass hasn’t yet released carbon dioxide before the northern winter, and peaking in May before northern hemisphere forests have really begun to reabsorb it. This means that COVID’s clean air aftereffects hit just as seasonal CO2 growth approached its peak.
Early estimates are that pandemic shutdowns led to an 8% drop in anthropogenic CO2 output, and that it would take 20-30% reductions for at least six months to put a dent in atmospheric readings. As climatologist Katherine Hayhoe notes, imagine all the carbon we’ve put into the atmosphere as a pile of bricks. We’ve been piling them up for about 250 years, more or less, and cutting a slice from latest brick dropped on top of the pile doesn’t make that much of a difference. And we’re already seeing a rapid rebound in human CO2 output; “Things have happened very quickly”, in the words of one climatologist tracking current conditions as economic activity ramps back up again.
So if even something as disastrous as COVID can’t substantially alter the pace at which CO2 continues to pile up in the planet’s atmosphere, what will? And if all the efforts made to clean up our energy act to date haven’t materially changed things, what can? It would be easy to throw up our hands and assume that this spring’s lack of substantive results represents something permanent.
It doesn’t.
We are at an inflection point in how we produce and use energy and the pace of change is only accelerating. Coal, the dirtiest source of electricity, is dying in multiple major economies. June 10th marked 61 straight days that the United Kingdom didn’t generate one kilowatt from coal. COVID has cut demand, so that and an unusually sunny May are part of the story, but the UK’s power grid has fundamentally changed. A kilowatt of electricity cost as much as 600 grams of CO2 in 2012 – this spring, as little as 125. And this took place even as the country’s population grew from 64.5 million in 2012 to 68.9 million this year. In the US, electric output from all renewables surpassed electricity from coal for the first time since the 1880s, and coal has essentially collapsed as a utility fuel – from a peak in 2008 at around 23 quads (Quadrillion BTUs), it’s now producing around 12 quads, as the graph at the link above powerfully illustrates.
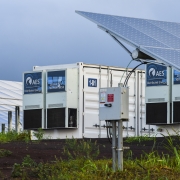
And it isn’t just a question of generating electricity. Large-scale battery storage, a long-time dream of clean power advocates, is expanding rapidly. 15 small-scale 9.95 MWh systems will support peak generation while smoothing out price spikes in Texas, and the state symbolized by the oil rig is already the nation’s leading wind generator. In California, PG&E is negotiating 1.7 GWh of storage with the state – more than ten times the power of the Texas sites mentioned above. Perhaps the single most striking change is the cost of solar energy; between 1980 and 2012, the cost of solar modules fell by a stunning 97%, and those costs keep dropping, just as solar cell efficiencies climb to as high as 47% in some experimental designs. Underpinning all of this is a simple, unignorable fact – renewables are now less expensive than fossil energy sources. Markets are responding – unevenly in some locations, swiftly in others but responding all the same.
The task that remains is immense. There is considerable doubt whether the goal of limiting further warming to 1.5 degrees C to avoid the worst of potential climate damage can be reached. There isn’t all that much time left. Lofty pledges of zero-emission goals by companies and countries by 2050 are fine, but we’ve already used up 1.5% of the time remaining between 2020 and 2050 to achieve those goals. And yet, for the first time, there now appear to be enough tools on the bench – technological and economic – to let us get started on meaningful work.


