July 12, 2023
Metropolitan Energy Center (MEC) is pleased to announce we were one of 27 applicants to get the green light from the U.S. Department of Energy to provide workforce development in support of better building policy.
MEC brought together partnerships within their extensive and diverse multistate network of 30 regional, state, and local community partners—including two growing community-based organizations—to build a workforce of energy-efficiency-related vocations in disadvantaged communities in urban and rural areas across Kansas and Missouri.
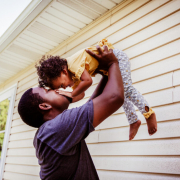
The selection rewards months of collaboration in response to our region’s need to upgrade its aging buildings to be more efficient, durable and healthy for human habitation. The initiative intends to support communities’ efforts to adhere to best-practice energy efficient construction for new and existing buildings—buildings science practices that lead to better human health, comfort, affordability, and resiliency in built environments.
The construction industry is facing change after the City of Kansas City, MO led a recent effort to update critical energy policy in our region. Other municipalities are expected to follow suit, an additional workforce is needed to support these efforts. Unfortunately, adequate training for energy efficiency and building science haven’t always been available. This initiative corrects that issue.
“As technologies improve and the industry learns more about the connection between building efficiency and human health, it is imperative that every community has access to resources to implement updated building construction policies,” said Mary English, MEC’s Building Performance Program Manager. “Especially as extreme weather events intensify, creating a skilled labor force to work in building performance vocations will lead to better buildings, better jobs, and more liquidity in the communities that have been left out of economic benefits by similar programs in the past.”
MEC is eager to begin working on the project with partners to equip communities across Kansas and Missouri with safe and healthy places to live, work and play for years to come.
About the Bi-State Partnership: Our partnership includes these organizations: Beyond Housing; Boys and Girls Club of the Ozarks; Cabanne District Community Development Corporation; City of Columbia, Missouri; City of Kansas City, Missouri; Climate Action KC (Building Energy Exchange Kansas City); Climate + Energy Project; Hathmore Technologies; J. Gordon Community Development Corporation; Kansas City Kansas Community College; Kansas Department of Commerce and Office of Apprenticeship; LivZero, LLC; Mid-America Regional Council; Midwest Energy Efficiency Alliance; Missouri Alliance of Boys and Girls Clubs; Missouri Botanical Garden and EarthWays Center; Missouri Gateway Green Building Council; Building Energy Exchange St. Louis; Missouri Department of Higher Education and Workforce Development; Missouri University of Science and Technology; National Institute for Construction Excellence; RATERusa, LLC; Resiliency at Work 2.0 Career and Technical Education; State of Missouri, Department of Natural Resources’ Division of Energy; Strategic Workforce Development; University of Missouri – Columbia; Verdatek Solutions, LLC; Workforce Partnership (Kansas); Washington Wheatley Neighborhood Association.